Table of Contents
1 Introduction
I’ve been wanting to do this for a very long time indeed. The City State of the Invincible Overlord (CSIO) came out in the 70’s and a revised edition in 1980 or thereabouts. Over the course of several publications and 18 maps of about 38,000m² each, Judges Guild mapped out and gave basic population statistics for an area (“The Wilderlands”) about the size of modern Libya, or the UK, France, Germany, Italy, Poland, and a bit of Belgium put together.
One thing that was never clear to me was just how wild the “wilderlands” were. There’s not much in the way of roads, and the basic terrain is not open plains but light woods, with some plains interspersed. Did the towns marked trade with each other much? How dominant were the handful of city stats and how dependant on their satellite towns where they in turn? Where would a pirate or bandit lurk and by extension where would patrols be placed to protect the trade routes?
Around 1989 or so I bought a book - Settlements by Meyer and Huggett - in a Cancer Research charity shop which introduced me to Reilly’s theory of retail gravitation (from 1929). The idea was that trade between two settlements could be modelled based on the product of the populations divided by the distance between them raised to some power. Add in some constant multiplier to scale it to specific units and the resulting formula looks a lot like the standard Newtonian one for gravity, hence the name.
The specific reason I bought the book was that I thought that I could use it to somehow model the trade pattern in the Wilderlands of the CSIO. Nearly 30 years have passed since that day and finally I’ve gotten around to it! What can I say? I had a long list of things to do.
The catalyst for finally doing this was two-fold: firstly I had been nursing an idea for a path-finding algorithm for a couple of years which I had hopes for, not only for geographic path finding but for broader applications in code optimisation. Secondly, I stumbled across von Thünen’s model of the “Isolated City State” and how he showed a city state’s surrounding economic area could be seen to diverge from a theoretical model under the influence of terrain and transport factors, something I was seeing in my reading around mediaeval London and its trade patterns. I even found a couple of websites that demonstrated this with some limited path-finding algorithms.
One attractive aspect of von Thünen’s model was that it is essentially pre-industrial and focused on agricultural questions which were broadly applicable back into the mists of time.
2 Method
So, Reilly used distance, but what is “distance”? Straight line distance is clearly nonsensical; as von Thünen emphasised, the real distance should be measured in time. Since we’re dealing with D&D here, that meant looking at movement rates. But underlying this was a deeper question about the nature of trade. In the von Thünen model, different sorts of produce are segregated into bands around the city state, primarily by their perishability and this maps directly into Reilly’s theory where the power distance is raised to relates to the urgency of delivery. The obvious example is that fresh milk, especially before refrigeration, simply has to be produced near or in the city.
By extension of this idea, it’s clear that on the scale of the Wilderlands maps very little trade is done in such products and if the CSIO needs milk it must be producing it itself in the surrounding hex of farmland or getting from very close-by up the Twilight Road or down the Old South Road. In any case, such things would not make up a huge amount of the trade on the map as published, where roads are very rare indeed.
For the sort of bulk non-perishable goods I was thinking about - timber, grain, metals, wine etc. - the value drops of linearly. Which is to say that the value of the product is constant, at least on a time scale of a season or two, and profit is eroded as much by the costs of the fifth day on the road as it is on the first. For milk, the second day erodes profit much faster than the first, and by the fifth you’ve got nothing left to sell.
This makes Reilly’s power simply equal to one. Since I’m only looking at relative levels of trade I don’t need a constant to convert into units (yet), so the final version of the formula is just
trade=pop1*pop2/travelTime
and all I had to do was calculate the travel time between every city on the map (all 98 of them).
I looked at how to do this using the hex map. I tried a lot of things but eventually I had to admit that the hex map simply wasn’t good enough. Forests and especially rivers did not follow hex sides and trying to encode them as side data ballooned. Eventually I realised that “hexpath” would have to be come “pixepath”, and the map would have to be some sort of bitmap image where each pixel was given one and only one terrain value.
2.1 A Star is born, then dies, is reborn, and finally discarded
I had been mulling this path finding idea for a while. I have written a few chess playing programs over the years, including a Dragon Chess written in M68000 assembly, and had been struck by the whole idea of quickly finding a move, and then progressively trying to find a better move. If the first “guess” move is sensibly chosen then the search time is drastically improved as candidates can be discarded early.
What, I thought, if we took a direct line from Point A to Point B over a map as a first guess, and then tried to refine it from there?
I constructed a test map and gave it a go. Well, to cut a long story short, it didn’t work. Looking back, I was gradually approaching the correct answer but my biggest problem was actually the direction of travel. Going from start to finish, my algorithm was constantly tripping over itself because the square it had “come from” at each step was not itself in a resolved and final state so it ended up looping over and over again. Adding flags didn’t help as that left the previous square as an unknown, preventing any objective early cutting out of paths by comparing them to the first guess.
I gradually started peeking at the Internet for help and found the A* algorithm. This is based on Dijkstra’s algorithm and like his it starts at the end and works backwards. Since the search starts with an objectively completed square (the destination, who’s cost is by definition known to be zero), it avoids the problem of tripping over its own tail and can always complete.
So I redid the code to use A* and things were good. For a while.
As it turns out, A* is a very fast way to find the distance between two points. But to find the distance between 97 points and a 98th, it’s not so hot. In my earlier code I had cached a lot of data in the hope of re-suing it, but A* doesn’t do that, so each run through starts from nothing again. For my code, once there were about 7 cities on the map, A* was getting slow.
Once I switched from a small test map to the map included in the code, which is 1807x1349 (8px = 1 mile), with lots of terrains, A* died a death. Going back to Dijkstra’s original algorithm, I realised that it in fact caches the whole map. Once Dijkstra’s has run once the output is the cost of moving from any point on the map to your chosen city. This means that finding the route from Thunderhold to CSIO takes 3 minutes - much longer than A* - but those three minutes also get you the distance from every other city and point on the map. Over all, this is a huge advance over A*.
2.2 Drunken Sailors, not Bee-lines
The first runs with the code generated trade routes all right. But they didn’t look very realistic. Partly this is because Dijkstra’s algorithm is known to behave slightly odd on a grid like a bitmapped image, but also because the transition between two pixels of light wood, or between light wood and open plain, always costs the same. So the trade routes were all made of horizontal, vertical, or 45° lines.
Adding a small pseudo-random factor to the cost of each square had a much larger effect than I had expected and the routes now look quite good, although not perfect.
2.3 Plains, Boats, and Roads
The next problem was that everything went by boat as far as possible. It’s certainly true that river and sea trade were extraordinarily important for mediaeval trade and one thing that modern people really don’t appreciate as they fly along the motorway at 70+mph is the humble bridge.
Until the 13th century, Britain had a massive shortage of bridges over rivers. If you have a one-ton cart being pulled by a couple of horses, even quite a small stream was an obstacle. If you were using oxen it was even worse as their short legs meant they would drown in a stream that a man could probably wade across.
So, yes, rivers should be important but they were insanely so when I first started to add significant numbers of towns to the map. The solution was to think more about what was being modelled: bulk goods.
One does not simply throw a ton of goods onto a barge and demand to be taken to Modor Modron. You generally have to wait for the tide, the ship to be ready, perhaps for other goods to be loaded up etc. So there’s a delay. There’s also a delay at the other end, albeit a smaller one.
Similarly, where an adventuring party might simply build a raft and enter a river or even the sea almost anywhere, if they needed to, 10cwt of barley needs something more sophisticated. So, rivers became a barrier again, except at settlements. And at settlements, the assumption is that on average goods set off on the boat/ship/barge, the day after they arrive, and 6 hours are needed to get unloaded and underway at the other end.
Cobbling together transport is still possible but it’s madly expensive. Similarly, switching from or to river transport at a ford can be done but it takes a week.
Finally, there is an assumption that the boats in question are quite small and do not handle the larger swell of the open sea as well as they do the more sheltered areas near the coast, so movement rates for the former are reduced. At the moment, I’ve defined (using the map) “open sea” to be anywhere more than 5 miles from any coast.
Movement aside from the special delays for transshipping is defined using D&D scaled inches so that it’s easy to relate to. Normal overland movement in D&D is 2xMv. So, a move rate of 12“ translates to 24 miles per day. I’ve pre-calculated the 2x part in order to allow some finer-grained rates as shown in the code snippet below:
\ These values are effectively 2 x the normal D&D move rates
+terrain impassible
infinite impassible self!
32 " opensea  \ slightly more risky, so avoid if possible
18 " city
48 " coastal
18 " plains
 9 " woods
24 " roads
12 " ltwoods
 9 " hills
 6 " wdhills
 1 " mts
 1 " swamp
 6 " desert
 4 " scrub
 6 " rough
30 " river
12 " ford
1 " jungle
4 " snow
I’ve not used snow yet. Note that the order of these terrains matches, and defines, the code used in the bitmap, so impassible is zero, open-sea is 1, city is 2 etc. When the program starts up it displays the combined movement table, which looks like this at the moment (probably best in the print-friendly version):
| opensea | city | coastal | plains | woods | roads | ltwoods | hills | wdhills | mts | swamp | desert | scrub | rough | river | ford | jungle | snow | ||
| 1 | opensea | 15 | 960 | 12 | 53760 | 53760 | 53760 | 53760 | 53760 | 53760 | 53760 | 53760 | 53760 | 53760 | 53760 | 15 | 53760 | 53760 | 53760 |
| 2 | city | 3840 | 26 | 3840 | 26 | 39 | 23 | 33 | 39 | 53 | 253 | 253 | 53 | 73 | 53 | 3840 | 33 | 253 | 73 |
| 3 | coastal | 12 | 960 | 10 | 115200 | 115200 | 115200 | 115200 | 115200 | 115200 | 115200 | 115200 | 115200 | 115200 | 115200 | 13 | 115200 | 115200 | 115200 |
| 4 | plains | 53760 | 26 | 115200 | 26 | 39 | 23 | 33 | 39 | 53 | 253 | 253 | 53 | 73 | 53 | 115200 | 33 | 253 | 73 |
| 5 | woods | 53760 | 39 | 115200 | 39 | 53 | 36 | 46 | 53 | 66 | 266 | 266 | 66 | 86 | 66 | 115200 | 46 | 266 | 86 |
| 6 | roads | 53760 | 23 | 115200 | 160 | 36 | 20 | 30 | 36 | 50 | 250 | 250 | 50 | 70 | 50 | 115200 | 30 | 250 | 70 |
| 7 | ltwoods | 53760 | 33 | 115200 | 33 | 46 | 30 | 40 | 46 | 60 | 260 | 260 | 60 | 80 | 60 | 115200 | 40 | 260 | 80 |
| 8 | hills | 53760 | 39 | 115200 | 39 | 53 | 36 | 46 | 53 | 66 | 266 | 266 | 66 | 86 | 66 | 115200 | 46 | 266 | 86 |
| 9 | wdhills | 53760 | 53 | 115200 | 53 | 66 | 50 | 60 | 66 | 80 | 280 | 280 | 80 | 100 | 80 | 115200 | 60 | 280 | 100 |
| 10 | mts | 53760 | 253 | 115200 | 253 | 266 | 250 | 260 | 266 | 280 | 480 | 480 | 280 | 300 | 280 | 115200 | 260 | 480 | 300 |
| 11 | swamp | 53760 | 253 | 115200 | 253 | 266 | 250 | 260 | 266 | 280 | 480 | 480 | 280 | 300 | 280 | 115200 | 260 | 480 | 300 |
| 12 | desert | 53760 | 53 | 115200 | 53 | 66 | 50 | 60 | 66 | 80 | 280 | 280 | 80 | 100 | 80 | 115200 | 60 | 280 | 100 |
| 13 | scrub | 53760 | 73 | 115200 | 73 | 86 | 70 | 80 | 86 | 100 | 300 | 300 | 100 | 120 | 100 | 115200 | 80 | 300 | 120 |
| 14 | rough | 53760 | 53 | 115200 | 53 | 66 | 50 | 60 | 66 | 80 | 280 | 280 | 80 | 100 | 80 | 115200 | 60 | 280 | 100 |
| 15 | river | 15 | 640 | 13 | 115200 | 115200 | 115200 | 115200 | 115200 | 115200 | 115200 | 115200 | 115200 | 115200 | 115200 | 16 | 26880 | 115200 | 115200 |
| 16 | ford | 53760 | 33 | 115200 | 33 | 46 | 30 | 40 | 46 | 60 | 260 | 260 | 60 | 80 | 60 | 26880 | 40 | 260 | 80 |
| 17 | jungle | 53760 | 253 | 115200 | 253 | 266 | 250 | 260 | 266 | 280 | 480 | 480 | 280 | 300 | 280 | 115200 | 260 | 480 | 300 |
| 18 | snow | 53760 | 73 | 115200 | 73 | 86 | 70 | 80 | 86 | 100 | 300 | 300 | 100 | 120 | 100 | 115200 | 80 | 300 | 120 |
These costs are scaled to the 1px=1furlong of the bitmap. Notice that it’s not symmetrical: going from city to river costs 3840 movement points, and from river to city costs 640.
When considering these movement rates bear in mind that they’re for a horse-drawn wagon when on land.
2.4 Hard Border
The biggest limitation of what I’ve done so far is, of course, the map edge. The results below all assume that there is nothing beyond the map, including the western edge where of course the City State of the World Emperor lies.
2.5 Moving House
Beyond adding in a “wooded hills” terrain in a couple of places, the main changes I made to the map was to move some of the towns to more logical places. I never moved any outside of their own hex but, for example, Seasteadholm was moved to the coast instead of being a couple of miles inland. I assume the cartographer had to fit the symbols into the map and there wasn’t always room when there were also wood’s rivers, and coastal cliffs to show. Similarly, if a settlement is elven and there are woods in the hex, I moved them into the woods at least a bit.
2.6 Here Don’t Be Dragons
The biggest lack of this iteration of the code is the lack of monsters and castles. In some way, both of these should affect trade. Both are given in the guidebooks but their effect must be based at least partially on movement - a group of ogres three miles away across water is unimportant, while the same group by the side of a road is going to have an impact on trade. Castles may reduce the effect of monsters, but may also impose their own tolls.
Given that the 98 towns require something like 5hrs to analyse at the moment, this is going to have to wait.
3 Other Factors
Once the raw data was calculated, giving a basic figure for the trade between two settlements, a couple of other factors were added in which Reilly probably didn’t spend much time on: race, alignment, and civ (tech) level.
3.1 Race
The race relations were based on the tables in PHB and DMG with some fiddling to join them together, as well as the addition of balrogs - a feature of the wider CSIO. The letters used in the game (P, G, T etc.) were mapped to specific multipliers (100% for prefer-ed,; 32% for hated; 10% for feared, a new category).
100 constant p
95 constant g
86 constant t
71 constant n
55 constant a
32 constant h
10 constant f

\ dw el gn  he  hb  ho  hu  gl  go  og  or  ba
p , a , g , n , g , h , n , h , h , h , h , f , \ dw dwarf
a , p , t , g , t , a , n , a , a , h , h , f , \ el elf
g , t , p , t , g , h , n , h , h , f , h , f , \ gn gnoll
n , p , t , p , n , a , t , a , a , h , h , f , \ he half-elf
g , g , t , n , p , n , n , f , h , f , f , f , \ hb hobbit
h , a , h , a , n , p , t , n , t , g , h , g , \ ho half orc
n , n , n , t , n , n , p , a , a , h , h , f , \ hu human
h , h , h , h , h , h , a , p , a , g , t , g , \ gl gnoll
h , a , h , a , h , t , a , a , p , h , n , g , \ go golin
f , f , h , f , a , t , t , t , a , p , t , n , \ og ogre
f , f , h , h , a , g , t , n , t , g , h , g , \ or orc
h , f , h , f , n , g , t , n , g , n , g , p , \ ba balrog
Since the race relations are not symmetrical, they’re calculated for each side of the trade and combined, so that if trade occurs between orcs and goblins the overall modifier is .95*.71=67.45% of normal.
3.2 Alignment
Alignment is handled the same way but the percentages were loosely based on the loyalty modifiers in the DMG. On that note, I resolved the question about “1 step, 2 steps, 3 steps” by ruling that changing any letter to N was one step, but that someone at N could move to any alignment in a single step. So LG->LE is two steps (LG-LN->LE) but LG to CE is three (LG->NG->N->CE). Fudge-a-rama.
create aligntradetab
\ N    LG  NG   CG   CN   CE   NE   LE   LN
85 , 100 , 85 , 80 , 75 , 65 , 70 , 90 , 95 , \ N
70 , 100 , 85 , 65 , 50 , 30 , 35 , 75 , 95 , \ LG
85 , 100 , 85 , 80 , 60 , 50 , 55 , 75 , 80 , \ NG
70 ,  85 , 85 , 80 , 75 , 50 , 35 , 55 , 60 , \ CG
85 ,  85 , 70 , 80 , 75 , 65 , 55 , 75 , 80 , \ CN
70 ,  65 , 50 , 65 , 75 , 65 , 70 , 75 , 60 , \ CE
85 ,  85 , 70 , 65 , 60 , 65 , 70 , 90 , 80 , \ NE
70 ,  85 , 50 , 45 , 40 , 50 , 70 , 90 , 95 , \ LE
85 , 100 , 70 , 65 , 60 , 50 , 55 , 90 , 95 , \ LN
Generally, people trust Lawful and Good -types most, and Neutrals are suspected a bit by everyone.
3.3 Civilisation Level
Each town is given a civ rating in the guidebooks and I’ve modelled this by simply them together, adding 1, and then multiplying trade volume by that. So a civ 8 trading with a civ 5 gets a 14x multiplier while a civ 9 trading with civ 9 gets an 19x multiplier.
The median civ rating seems to be about 5, so x11 (5+5+1) is the “normal” rating.
4 The Results
4.1 Trade Routes
This was the original target question: what are the trade routes? The current base map is (note: these maps are not opening when clicked on but if you select "Open in new tab" you should get the full-res versions):
https://raw.githubusercontent.com/tworthington/csiotrade/master/map1.bmp
Overlaying trade routes, with the boldness of the route being proportional to the amount of trade, gives this (open sea removed for clarity:
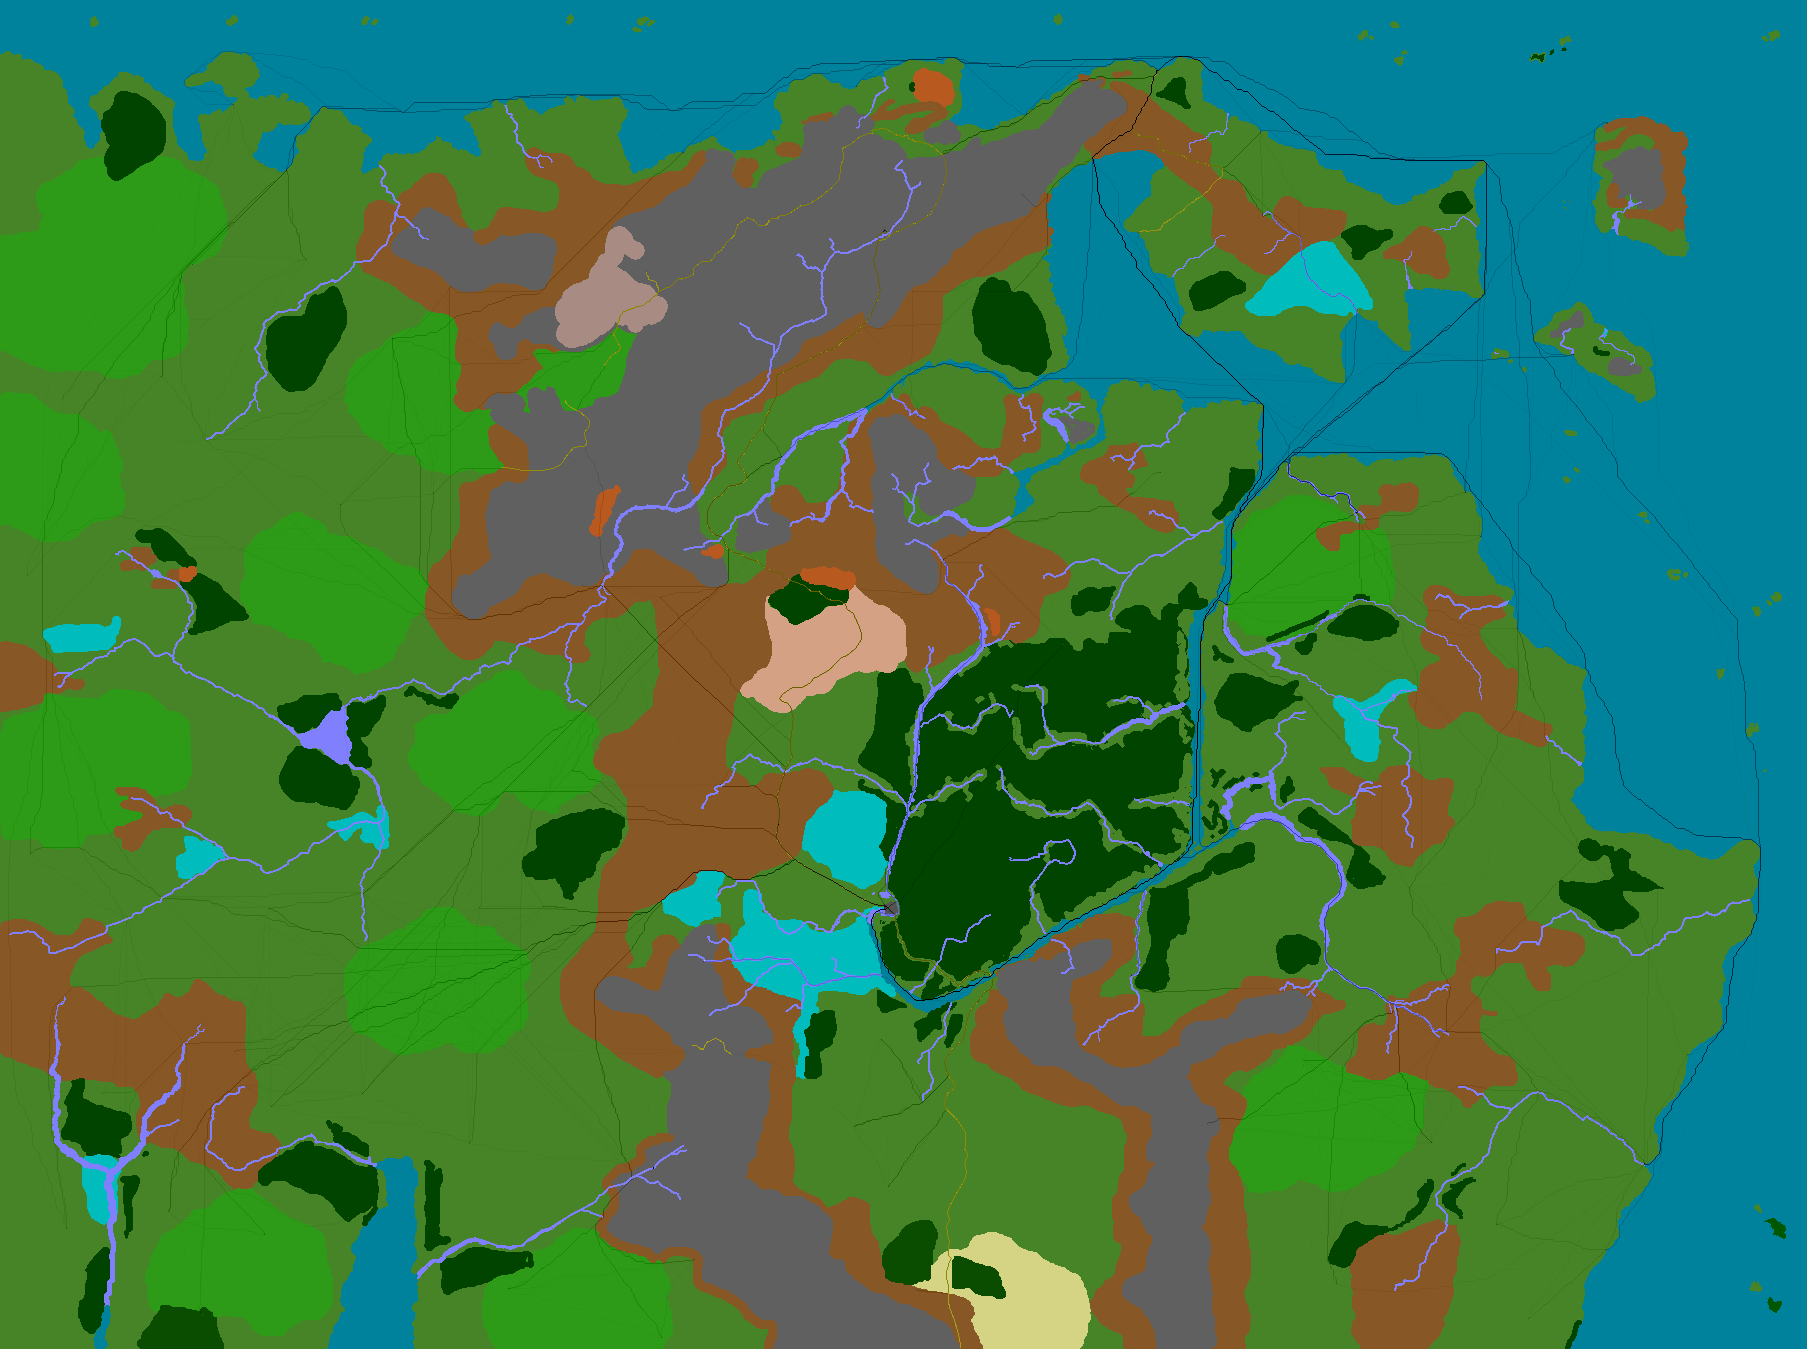
Figure 1: Graduated Trade Map
Here’s the same map but with the routes shown at the same boldness regardless of the amount of traffic:
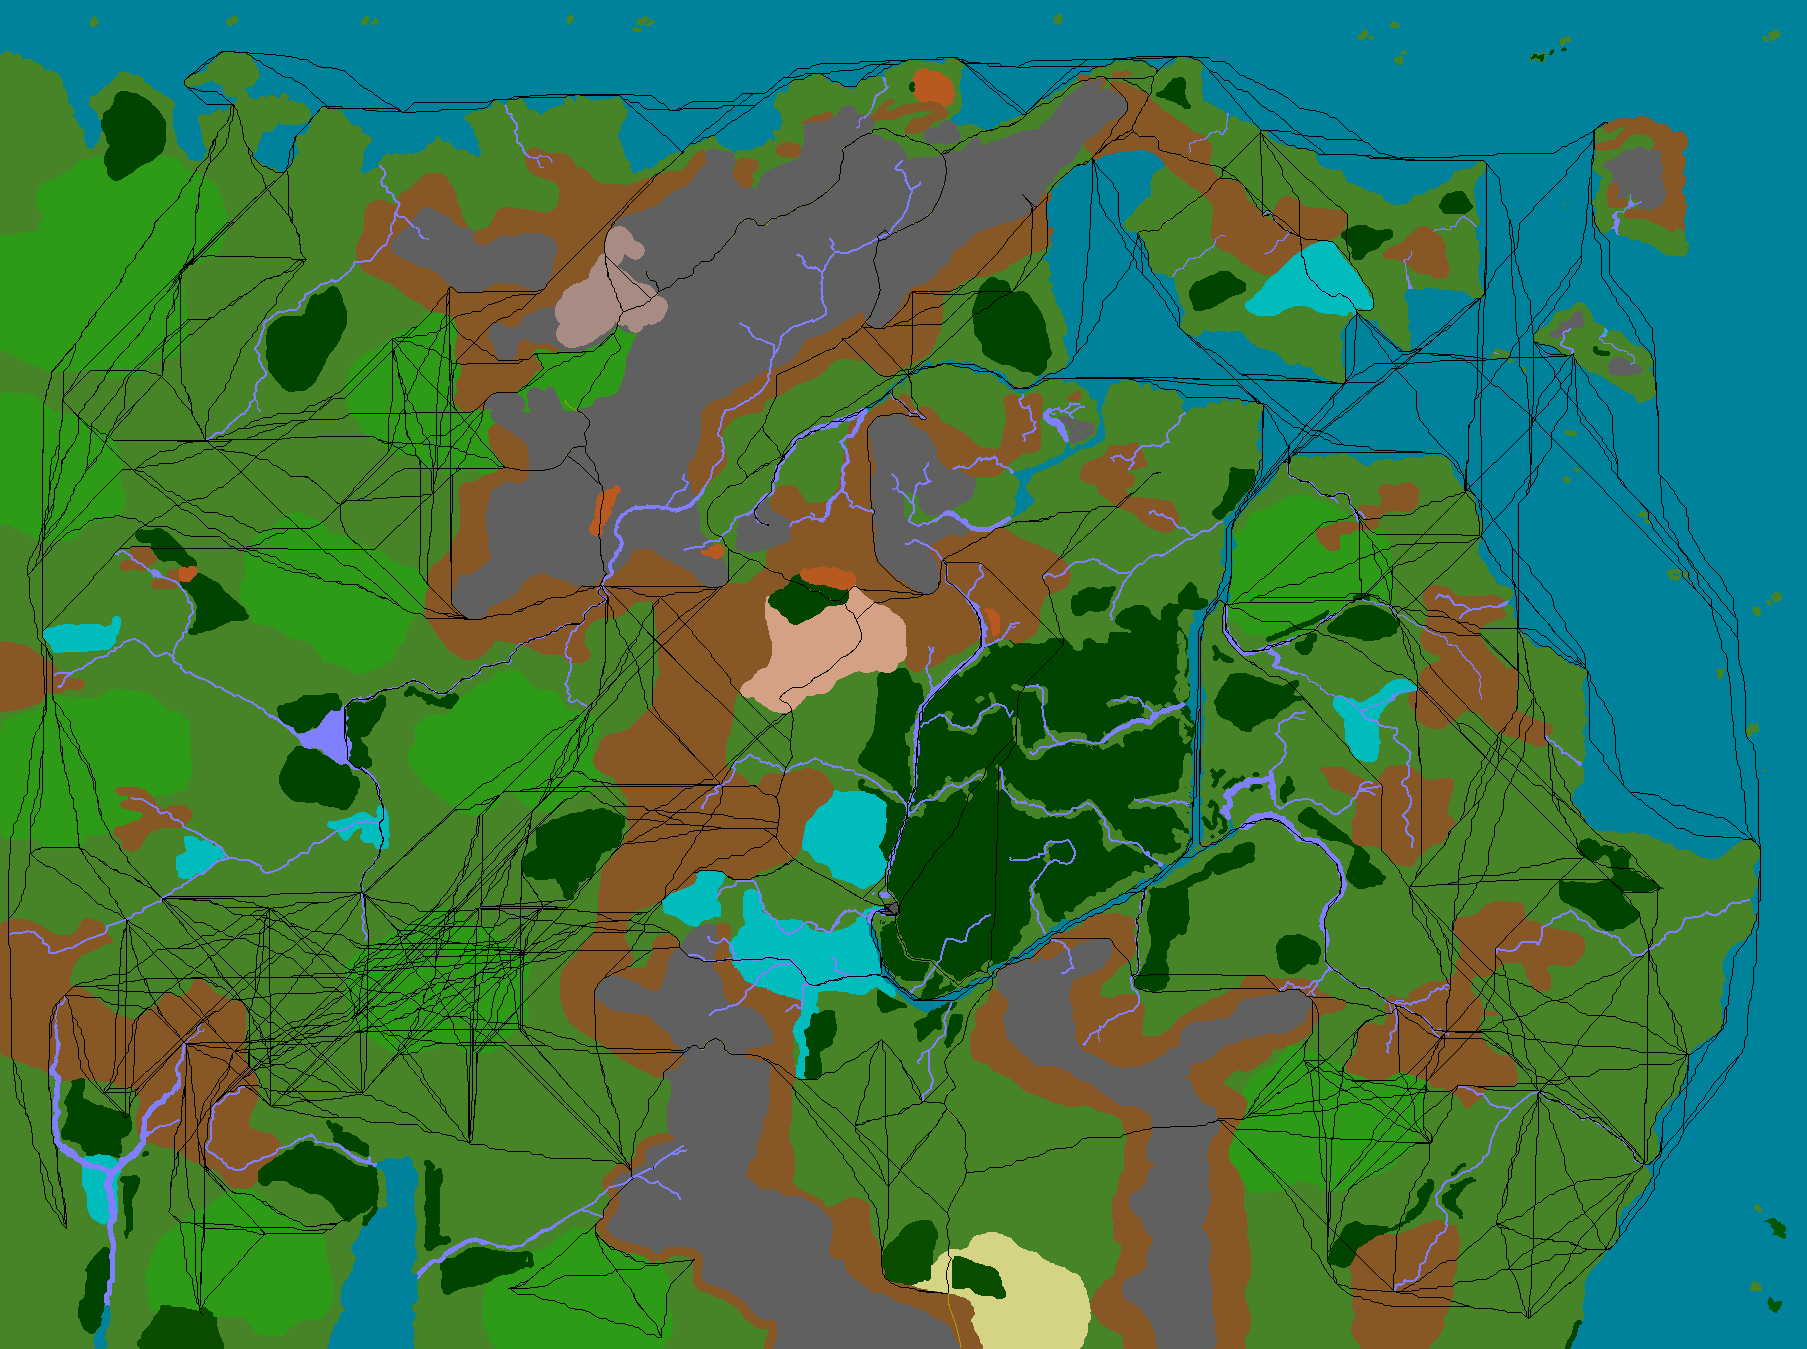
Figure 2: Un-Graduated Trade Map
The next map is one that relates mostly to von Thünen’s model a bit more. This is a graduated tint overlaid on the map and centred on the CSIO itself, each step from light to dark indicating one day’s travel to the city.
I’ve pushed the bounds of copyright here to allow some of the original map to show through under my coloured version and the tint.
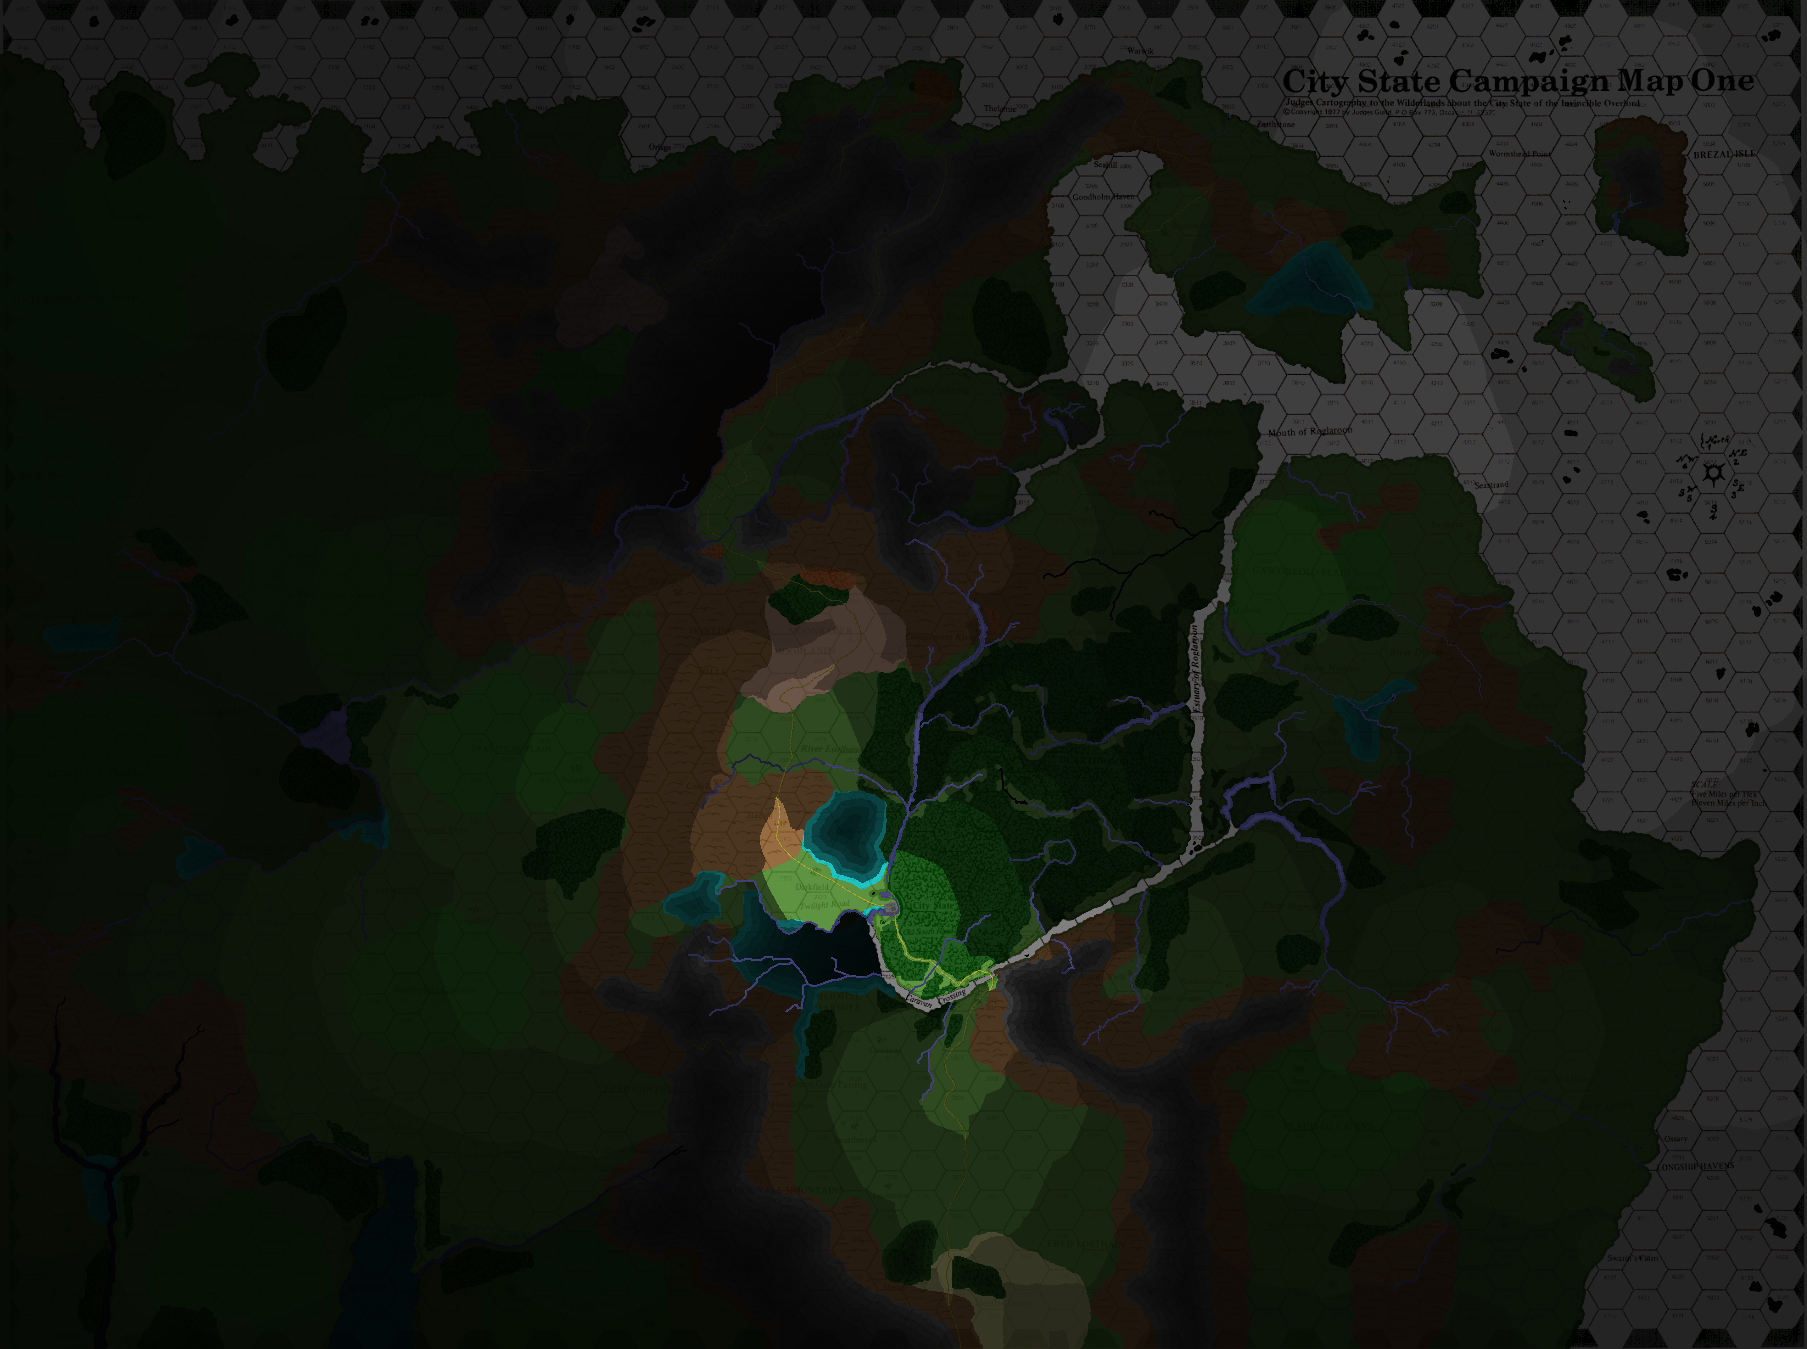
Figure 3: Days Travel To CSIO
It’s worth looking at this map for a while and visualising how much you know about places that are 5½ days travel away from you - the distance that Thunderhold is from CSIO. Assuming that you can think of anywhere that would take 5½days to get to in the modern world!
The final map is just for interest and superimposes a map of Kent on Wilderlands map 1 to show the scale. Basically, each Wilderlands map covers an area of 24.3 million acres (38088m²), which is about ¾ of the size of England.
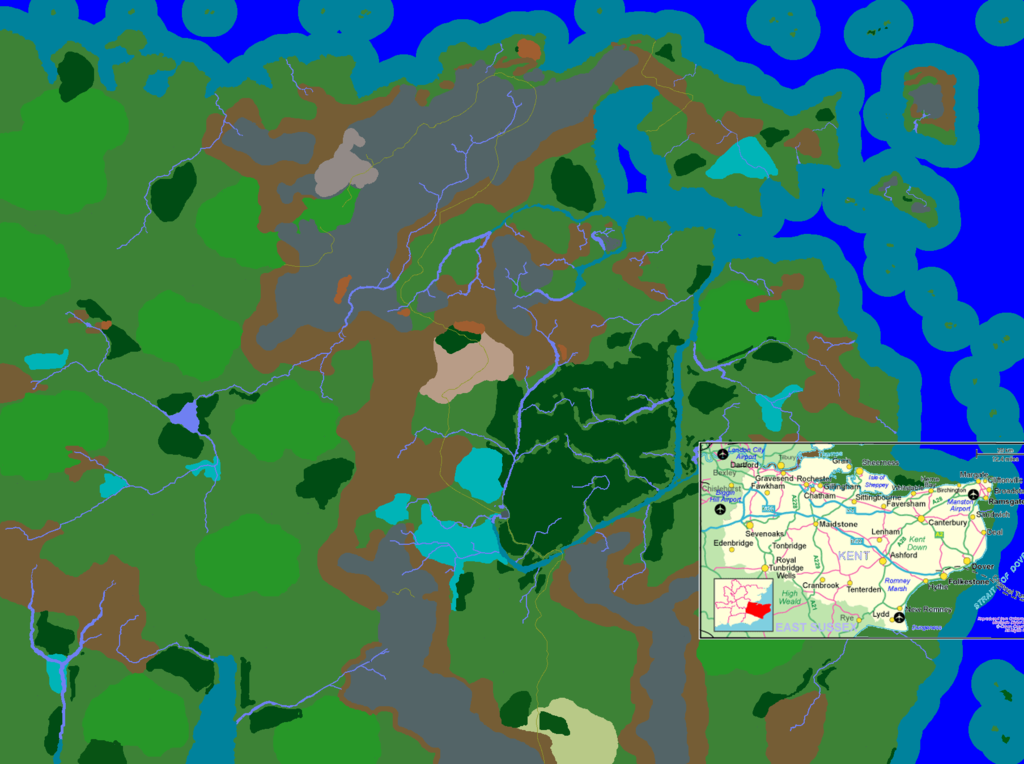
Figure 4: Kent for scale
4.2 Trade Volumes
Trade is measured in arbitrary units for now and the program captures two main numbers for each settlement: the amount of external trade it engages in itself, and the amount of trade which passes through it on the way to somewhere else.
Since each town has a listed population we can translate these numbers into a measurement of wealth, even if we don’t have a specific ratio to convert it into gps. Another obstacle to making too much of these numbers - creating a measure of GDP - is that these numbers are all for external trade and don’t capture anything at all about internal trading within each town.
Taking tax on passing trade at a rate of 5% (1 shilling per pound) and adding it to the main trade figure gives the following table ordered by total income per person:
| City | Trade | Per Person | Via | +tax |
|---|---|---|---|---|
| Darkfield | 21199 | 121 | 117863 | 149 |
| Haghill | 7150 | 47 | 54507 | 63 |
| Sea Hill | 11342 | 38 | 153155 | 62 |
| Modron | 59829 | 48 | 59973 | 48 |
| Bier | 7187 | 42 | 7187 | 42 |
| Thelamie | 5778 | 35 | 21603 | 40 |
| Croy | 18179 | 39 | 18179 | 39 |
| Brushwood | 4614 | 34 | 4614 | 34 |
| Wolfstone | 13457 | 33 | 13457 | 33 |
| Sticklestead | 81295 | 32 | 82366 | 32 |
| Woe | 8431 | 31 | 8431 | 31 |
| Seastrand | 12553 | 30 | 12553 | 30 |
| Ottersgild | 5460 | 29 | 5460 | 29 |
| Dearthmead | 9288 | 29 | 9288 | 29 |
| Zarthstone | 12170 | 29 | 12823 | 29 |
| Tain | 11034 | 27 | 16507 | 28 |
| Armagh | 7741 | 28 | 7741 | 28 |
| Fireside | 9373 | 28 | 9373 | 28 |
| Luckstone | 6270 | 27 | 6270 | 27 |
| Warwik | 259121 | 27 | 259121 | 27 |
| Anvil | 4846 | 26 | 4846 | 26 |
| Goodhap | 5726 | 26 | 5726 | 26 |
| Smitten | 10539 | 22 | 25241 | 24 |
| Tegal | 5340 | 23 | 10672 | 24 |
| Byrny | 10923 | 23 | 22016 | 24 |
| Muskholm | 8985 | 23 | 8985 | 23 |
| Rockhollow | 4821 | 22 | 4821 | 22 |
| Gaehill | 9021 | 22 | 9021 | 22 |
| Oakenbridge | 6847 | 21 | 14383 | 22 |
| Swarin’s Cairn | 3211 | 20 | 5226 | 21 |
| Flint | 6264 | 21 | 6264 | 21 |
| CSIO | 435882 | 21 | 435939 | 21 |
| Ryefield | 2773 | 21 | 2994 | 21 |
| Omen | 4500 | 19 | 15445 | 21 |
| Mill Haven | 3713 | 19 | 5869 | 20 |
| Shewolf | 3276 | 20 | 3276 | 20 |
| Sea Rune | 2591 | 19 | 2742 | 19 |
| Troth | 3523 | 19 | 3796 | 19 |
| Dorn | 4259 | 18 | 4259 | 18 |
| Thunderhold | 36340 | 18 | 36340 | 18 |
| Orlage | 2894 | 17 | 7012 | 18 |
| Foremost | 5957 | 17 | 5957 | 17 |
| Bernost | 8304 | 17 | 8304 | 17 |
| Carmage | 3931 | 16 | 3931 | 16 |
| Greybeard | 7277 | 16 | 7277 | 16 |
| Sunlitten | 7429 | 16 | 7440 | 16 |
| Limerick | 2230 | 14 | 4288 | 15 |
| Finmark | 4510 | 15 | 4510 | 15 |
| Lakenheath | 8126 | 15 | 9226 | 15 |
| Wormingford | 1751 | 10 | 20486 | 15 |
| Heatherbush | 2883 | 14 | 2883 | 14 |
| Bulwark | 4267 | 14 | 4267 | 14 |
| Hlymadle | 4887 | 14 | 4887 | 14 |
| Varin’s Firth | 6304 | 14 | 6331 | 14 |
| Ossary | 47768 | 14 | 47777 | 14 |
| Benobles | 3859 | 14 | 4775 | 14 |
| Irungsway | 2501 | 13 | 2501 | 13 |
| Springle | 5081 | 13 | 5081 | 13 |
| Landmarch | 5904 | 13 | 5904 | 13 |
| Red Cliffe | 1568 | 12 | 1599 | 12 |
| Ashenshaft | 5372 | 12 | 5445 | 12 |
| Charnock | 5795 | 12 | 5795 | 12 |
| Seasteadholm | 1889 | 12 | 2037 | 12 |
| Hankam | 2031 | 11 | 2031 | 11 |
| Hel | 5131 | 11 | 5131 | 11 |
| Bondmaid | 1953 | 11 | 2094 | 11 |
| Atwan | 3266 | 10 | 3266 | 10 |
| Hindfell | 3362 | 10 | 3365 | 10 |
| Elixer | 4188 | 10 | 4188 | 10 |
| Boughrune | 2154 | 9 | 2154 | 9 |
| Guilding | 2809 | 9 | 2809 | 9 |
| Doom | 3028 | 9 | 3028 | 9 |
| Caelam | 4432 | 9 | 4432 | 9 |
| Catalan | 4604 | 9 | 4604 | 9 |
| Shavenoar | 1192 | 8 | 1192 | 8 |
| Serpeant Little | 1209 | 8 | 1209 | 8 |
| Havocia | 1313 | 8 | 1313 | 8 |
| Jasonyria | 2110 | 8 | 2110 | 8 |
| Karn | 2296 | 8 | 2296 | 8 |
| Goblin Hill | 3817 | 8 | 3817 | 8 |
| Grita Heath | 810 | 7 | 810 | 7 |
| Smite | 2404 | 7 | 2404 | 7 |
| Anguikan | 2975 | 7 | 3031 | 7 |
| Lightelf | 3057 | 7 | 3057 | 7 |
| Elf-burn | 975 | 6 | 5122 | 7 |
| Forecastle | 939 | 6 | 939 | 6 |
| Adderwood | 1873 | 6 | 1873 | 6 |
| Palewood | 571 | 5 | 571 | 5 |
| Sunfells | 2280 | 5 | 2280 | 5 |
| Hunwood | 2615 | 5 | 2615 | 5 |
| Wildwood | 741 | 4 | 741 | 4 |
| Ered Chimera | 1032 | 4 | 1032 | 4 |
| Crucible | 521 | 3 | 521 | 3 |
| Hledra | 799 | 3 | 799 | 3 |
| Trollslore | 486 | 2 | 486 | 2 |
| Wenlock | 608 | 2 | 608 | 2 |
| Skaney | 742 | 2 | 742 | 2 |
| Dart | 293 | 1 | 293 | 1 |
Re-arranging the table to give the top 20 cities by raw trade gives us:
| City | Trade | PP | +tax |
|---|---|---|---|
| CSIO | 435882 | 21 | 21 |
| Warwik | 259121 | 27 | 27 |
| Sticklestead | 81295 | 32 | 32 |
| Modron | 59829 | 48 | 48 |
| Ossary | 47768 | 14 | 14 |
| Thunderhold | 36340 | 18 | 18 |
| Darkfield | 21199 | 121 | 149 |
| Croy | 18179 | 39 | 39 |
| Wolfstone | 13457 | 33 | 33 |
| Seastrand | 12553 | 30 | 30 |
| Zarthstone | 12170 | 29 | 29 |
| Sea Hill | 11342 | 38 | 62 |
| Tain | 11034 | 27 | 28 |
| Byrny | 10923 | 23 | 24 |
| Smitten | 10539 | 22 | 24 |
| Fireside | 9373 | 28 | 28 |
| Dearthmead | 9288 | 29 | 29 |
| Gaehill | 9021 | 22 | 22 |
| Muskholm | 8985 | 23 | 23 |
| Woe | 8431 | 31 | 31 |
4.2.1 CSIO
There’s not much to say about the City State itself. As expected, it is the largest economy and it draws in some trade from basically everywhere on the map. The biggest trading partner is Warwik at 26.2% of all trade. Here’s the whole list, down to those with 0.1% share:
| City | % CSIOTrade |
|---|---|
| Warwik | 26.2 |
| Sticklestead | 7.6 |
| Modron | 6.0 |
| Darkfield | 4.3 |
| Ossary | 4.2 |
| Thunderhold | 3.8 |
| Tain | 1.6 |
| Woe | 1.5 |
| Croy | 1.5 |
| Haghill | 1.4 |
| Dearthmead | 1.4 |
| Bier | 1.4 |
| Gaehill | 1.3 |
| Byrny | 1.1 |
| Luckstone | 1.1 |
| Seastrand | 1.1 |
| Sea Hill | 1.0 |
| Fireside | 1.0 |
| Lakenheath | 0.9 |
| Flint | 0.9 |
| Goodhap | 0.9 |
| Wolfstone | 0.9 |
| Foremost | 0.8 |
| Varin’s Firth | 0.8 |
| Smitten | 0.7 |
| Zarthstone | 0.7 |
| Oakenbridge | 0.7 |
| Charnock | 0.6 |
| Springle | 0.6 |
| Landmarch | 0.6 |
| Bernost | 0.6 |
| Bulwark | 0.6 |
| Omen | 0.6 |
| Muskholm | 0.6 |
| Rockhollow | 0.6 |
| Sunlitten | 0.6 |
| Armagh | 0.6 |
| Greybeard | 0.5 |
| Hlymadle | 0.5 |
| Goblin Hill | 0.5 |
| Hel | 0.5 |
| Dorn | 0.5 |
| Ashenshaft | 0.5 |
| Caelam | 0.4 |
| Shewolf | 0.4 |
| Anvil | 0.4 |
| Atwan | 0.4 |
| Carmage | 0.4 |
| Ottersgild | 0.4 |
| Brushwood | 0.4 |
| Tegal | 0.4 |
| Finmark | 0.3 |
| Elixer | 0.3 |
| Hindfell | 0.3 |
| Catalan | 0.3 |
| Anguikan | 0.3 |
| Hunwood | 0.3 |
| Troth | 0.3 |
| Thelamie | 0.3 |
| Limerick | 0.3 |
| Ryefield | 0.3 |
| Guilding | 0.3 |
| Benobles | 0.3 |
| Mill Haven | 0.3 |
| Jasonyria | 0.2 |
| Irungsway | 0.2 |
| Hankam | 0.2 |
| Doom | 0.2 |
| Bondmaid | 0.2 |
| Smite | 0.2 |
| Sunfells | 0.2 |
| Orlage | 0.2 |
| Adderwood | 0.2 |
| Boughrune | 0.2 |
| Wormingford | 0.2 |
| Heatherbush | 0.2 |
| Lightelf | 0.2 |
| Swarin’s Cairn | 0.2 |
| Sea Rune | 0.2 |
| Havocia | 0.1 |
| Shavenoar | 0.1 |
| Wildwood | 0.1 |
| Red Cliffe | 0.1 |
| Karn | 0.1 |
| Elf-burn | 0.1 |
| Seasteadholm | 0.1 |
| Serpeant Little | 0.1 |
4.2.2 Warwik
Yes, so. Warwik. No one ever talks about Warwik, but it’s one of the biggest cities in the whole setting, not just Map 1. Bigger than Tarantis, bigger than Valon by miles. It dominates the north coast and the only reason it is not more important as a trading partner is that the map ends just north of it.
As it is, it has more trade per person than CSIO and has a higher civ rating too.
4.2.3 Modron
Much smaller than Warwik, or even Ossary, the model used doesn’t, I think, give Modron due consideration for potential tax collection from passing vessels but since they don’t literally pass through the town the program doesn’t catch them. Even so, it has the second highest ratio of direct trade to population, after Darkfield, and on that measure the citizens are more than twice as wealthy as those of the CSIO.
| City | % Modron Trade |
|---|---|
| CSIO | 44.4 |
| Warwik | 18.5 |
| Sticklestead | 12.7 |
| Ossary | 2.8 |
| Croy | 1.3 |
| Seastrand | 1.0 |
| Thunderhold | 0.9 |
| Brushwood | 0.8 |
| Wolfstone | 0.7 |
| Byrny | 0.5 |
| Zarthstone | 0.5 |
| Fireside | 0.5 |
| Sunlitten | 0.5 |
| Armagh | 0.5 |
| Smitten | 0.4 |
| Tain | 0.4 |
| Varin’s Firth | 0.4 |
| Ryefield | 0.4 |
| Oakenbridge | 0.4 |
| Greybeard | 0.3 |
| Flint | 0.3 |
| Muskholm | 0.3 |
| Sea Hill | 0.3 |
| Hel | 0.3 |
| Rockhollow | 0.3 |
| Ottersgild | 0.3 |
| Ashenshaft | 0.3 |
| Tegal | 0.3 |
| Charnock | 0.2 |
| Finmark | 0.2 |
| Lakenheath | 0.2 |
| Bernost | 0.2 |
| Gaehill | 0.2 |
| Darkfield | 0.2 |
| Anvil | 0.2 |
| Dearthmead | 0.2 |
| Woe | 0.2 |
| Troth | 0.2 |
| Thelamie | 0.2 |
| Dorn | 0.2 |
| Benobles | 0.2 |
| Caelam | 0.1 |
| Springle | 0.1 |
| Hlymadle | 0.1 |
| Elixer | 0.1 |
| Hindfell | 0.1 |
| Landmarch | 0.1 |
| Catalan | 0.1 |
| Foremost | 0.1 |
| Smite | 0.1 |
| Omen | 0.1 |
| Orlage | 0.1 |
| Shewolf | 0.1 |
| Haghill | 0.1 |
| Goodhap | 0.1 |
| Luckstone | 0.1 |
| Ered Chimera | 0.1 |
| Atwan | 0.1 |
| Bier | 0.1 |
| Karn | 0.1 |
| Carmage | 0.1 |
| Limerick | 0.1 |
| Seasteadholm | 0.1 |
| Boughrune | 0.1 |
| Guilding | 0.1 |
| Wormingford | 0.1 |
| Heatherbush | 0.1 |
| Mill Haven | 0.1 |
| Lightelf | 0.1 |
| Swarin’s Cairn | 0.1 |
| Sea Rune | 0.1 |
- Pareto Curves
The question naturally arises from the above observation as to how the uppermost members of society compare between the CSIO and Modron, given that the (external trading) economy of the former is 7¼ times the latter.
If we use an 80/20 split (80% of wealth is owned by 20% of people) then we get the top 20% of Modronites are sharing 47863 between them, which is 129.7 units each. The same calculation for CSIO gives 348705 to the top 20%, which is 87. When looking at percentages this disparity holds, but for the CSIO the number of people sharing that wealth is much higher and the true picture comes out when looking at it from that PoV.
So when we look at the top 20 people in each place, the difference between the two cities’ elites is clearer. For Modron these people represent 1.6%, whereas for the CSIO they represent 0.1%. The 20 Modronites have 1695 units of wealth each, the City Staters average 8405 units each.
Ultimately, the top guy in Modron can expect to control 22424 units of trade while the Overlord grabs 111204 (assuming that the Overlord is as content to share as Anoethin is).
I’ve glossed over many questions here, not least of which are what slope to use for the Pareto calculation and how applicable it is to very small numbers of people in autocratic societies. Not to mention that populations listed in the guides are for able-bodied men of fighting age, not full populations. Perhaps "top families" would be a better way of looking at it.
4.2.4 Ossary
Although Ossary is big and technically advanced (civ 8), its alignment of CE costs it a lot of trade. Still, it dominates the southern area to a degree which can only increase once Map 2 is added. The largest city there, Antil, is just over ⅓ of the size of Ossary and somewhat backward with a civ rating of 4.
| City | % Ossary Trade |
|---|---|
| CSIO | 39.0 |
| Warwik | 23.5 |
| Sticklestead | 5.8 |
| Modron | 3.5 |
| Croy | 1.6 |
| Swarin’s Cairn | 1.4 |
| Sunlitten | 1.1 |
| Sea Rune | 1.0 |
| Oakenbridge | 0.9 |
| Heatherbush | 0.9 |
| Mill Haven | 0.8 |
| Lightelf | 0.7 |
| Smitten | 0.6 |
| Armagh | 0.6 |
| Varin’s Firth | 0.5 |
| Hel | 0.5 |
| Seastrand | 0.5 |
| Tegal | 0.5 |
| Greybeard | 0.4 |
| Bernost | 0.4 |
| Catalan | 0.4 |
| Byrny | 0.4 |
| Muskholm | 0.4 |
| Tain | 0.4 |
| Zarthstone | 0.4 |
| Wolfstone | 0.4 |
| Guilding | 0.4 |
| Ashenshaft | 0.4 |
| Caelam | 0.3 |
| Lakenheath | 0.3 |
| Dearthmead | 0.3 |
| Thunderhold | 0.3 |
| Woe | 0.3 |
| Thelamie | 0.3 |
| Rockhollow | 0.3 |
| Ottersgild | 0.3 |
| Dorn | 0.3 |
| Wormingford | 0.3 |
| Serpeant Little | 0.3 |
| Charnock | 0.2 |
| Finmark | 0.2 |
| Hlymadle | 0.2 |
| Hindfell | 0.2 |
| Landmarch | 0.2 |
| Gaehill | 0.2 |
| Flint | 0.2 |
| Darkfield | 0.2 |
| Anvil | 0.2 |
| Goodhap | 0.2 |
| Karn | 0.2 |
| Fireside | 0.2 |
| Benobles | 0.2 |
| Jasonyria | 0.1 |
| Irungsway | 0.1 |
| Springle | 0.1 |
| Elixer | 0.1 |
| Doom | 0.1 |
| Hunwood | 0.1 |
| Foremost | 0.1 |
| Smite | 0.1 |
| Sunfells | 0.1 |
| Orlage | 0.1 |
| Shewolf | 0.1 |
| Haghill | 0.1 |
| Ered Chimera | 0.1 |
| Troth | 0.1 |
| Atwan | 0.1 |
| Bier | 0.1 |
| Sea Hill | 0.1 |
| Limerick | 0.1 |
| Seasteadholm | 0.1 |
| Boughrune | 0.1 |
| Ryefield | 0.1 |
| Forecastle | 0.1 |
| Palewood | 0.1 |
4.2.5 Darkfield
Being on the road to CSIO as well as being physically close to it gives Darkfield a huge boost without being too incompatible on race, alignment, or civ.
4.2.6 Haghill
Like Darkfield, Haghill is near the city and gets a bigbump from that despite being small and undeveloped.
4.2.7 Sticklestead
Sticklestead is another large settlement that doesn’t get much of a look in, although an official scenario dealing with the area did come out in 2010(!). Bigger than Modron, it’s important because it allows access to the river and thereby to the sea, CSIO, and Warwik. I’ve also given it a bridge and a ford over the local rivers.
5 So what?
What to do with all this information? Well, the trade route maps show, for example, that Wormshead point is a good place to go a-pirating, and a place to send patrols to prevent it. There’s a line of small islands south of Croy which might make interesting bases for this sort of activity too, if the keyed encounters are not enough to put the players off.
The same goes for the land, with various crossroads apparent where PCs can prey on caravans, hire on to protect them, or where the DM can place inns or similar out-of-town bases.
PCs hired to locate lost cargoes or kidnapped merchants may be able to use their wits to learn of likely places to start a search.
The major cities will have rivalries and intrigues aimed at getting an economic advantage. Guilds from the cities will do likewise.
The information gives some idea of how likely it is to be able to learn something by locating a native traveller. So, finding someone from Warwik won’t pose too much trouble in most locations near the sea but finding people from Tegal to ask about its manor might be hard.
Even Thunderhold has only a 3.8% share of the City State’s trade.
There will be other uses, but for now I need to look at making the code multi-threaded so that I can hope to tackle adding on at least Map 6 and see what that does to the trade routes to the west.
All the Forth code is on Github (https://github.com/tworthington/csiotrade)
You are tackling a massive problem. Trade is dynamic, evolves, is easily perturbed by and the cause of war, ideally you want some simple rules and initial conditions and let a model run. I guess you are taking a snapshot and trying to devise rules for that moment in CSIO history, but maybe its like looking at a single snapshot of the solar system and trying to explain how the planets got to their positions rather than watching long evolutions, at least in terms of devising a system.
ReplyDeleteIt is hard to account for how technology affects speed and access, or how a sudden lust for tea in an entire population depletes a nation's silver stores. In any case trade is not a static problem.
It is a worthy problem in gaming though which like thoughtless geography can create a nonsensical environment for example whenever gamers use random tables without understanding the scope for randomness or dependence between elements.
I agree with all of that (and I picked Kent as the example county in your honour), but I had a couple of motivations, the main one being that I wanted to test out the algorithm and the code in preparation for applying a more dynamic approach to preparing my own setting. As you say, it is a snapshot but it is one in which potentialities can be seen. For example, a poor area near a wealthy area will tend to draw population from one to the other, changing the trading environment and the social one too. So I intend to move to a more iterative version.
DeleteI picked CSIO because it's a popular setting which has some parameters (civ level and alignment) which are suggestive of things that MIGHT be worth modelling in the context of D&D, and because I was sure it's a BAD setting for realism. Part of the test was to see if the approach highlighted (or possibly refuted) this weakness. If it didn't then I would be happy to discard it. I think it has at least shown me how badly sited some major cities are (Targnol Port stands out here). It's also suggested some interesting things about relative wealth which I "knew" but didn't often think about.
The level of detail you mention of modelling fads it probably out of scope for any computer simulation I'll ever bother to write, but population, race, and technology drift seems within reach.
Ultimately, I'm not so interested in using this model to "fix" CSIO. The longer term goal is something which aids the design of a new setting which will start as some basic settlements, then add the dynamics you are talking about (oh, there's a lot of trade along here, so let's put a road there. That makes a crossroads here, so we have at least an Inn and probably the start of a market town etc.). Roll that over a few iterations and see what you have.
Of course, there's no need to try this approach other than it's fun to me. Which is a good enough reason IMO.
An incredible amount of work here, Nags. Exactly the sort of stuff I’ve been looking for. I’m currently working on something similar (though much less technically astute) for my campaign.
ReplyDeleteI could have saved a lot of effort.
You know how it is - you start thinking about some aspect and before you know it you're well on the way to obsession. I've not revisited this aspect since, although it always sits in my mind, particularly the underratedness of Warwik.
Delete